
California’s Cap-and-Trade Reforms: July 2018 Comment Letter
Summary
From an environmental perspective, managing the cap-and-trade program’s excess supply of allowances is arguably the most important question affecting the design of ARB’s post-2020 market. Yet the California Air Resources Board’s discussion of this issue has continually failed to take into account the growing evidence—both in the Board’s own data and in multiple reports from credible, independent experts—that excess allowances from the market’s pre-2021 period are likely to be banked into the market’s post-2020 period, causing low market prices that are insufficient to induce serious climate mitigation and enabling emissions that are significantly higher than nominal program caps. Should these outcomes manifest, California will likely fail to keep statewide emissions below the mandated limit for 2030.
The Board’s first and only formal discussion of allowance overallocation is contained in its April 2018 Post-2020 Caps Report. There, ARB concluded that even if 150 million allowances are banked into the post-2020 market period, the cap-and-trade program would still generate at least as many reductions as called for in the 2017 Scoping Plan.
Unfortunately, the Post-2020 Caps Report contains a serious methodological error, which we documented in a May 2018 Research Note and an associated comment letter in response to the May 2018 cap-and-trade workshop. When adjusted for this error, ARB’s calculations show that banking 150 million excess allowances from the pre-2021 period would lead the program caps to be non-binding through 2030, causing the program to fall well short of the role ARB identified in the Scoping Plan.
Board staff continue to dispute our findings in a June 2018 workshop and assert the integrity of the proposed post-2020 program caps, despite admitting during the workshop to the specific error we identified in their past work. We respond to their assertions in detail and show that the proposed post-2020 program caps do not address the risk that the excess allowances currently building up in the program will cause future emissions to exceed state limits.

Figure 1: ARB’s projection of “covered sector” emissions compared with historical covered emissions and Near Zero’s projection of “covered emissions.” ARB’s Post-2020 Caps Report incorrectly used projections of “covered sector” emissions from the PATHWAYS model, which includes about 10% more emissions each year than the facility-level “covered emissions” that are actually subject to the cap-and-trade program.
(click on image to enlarge)
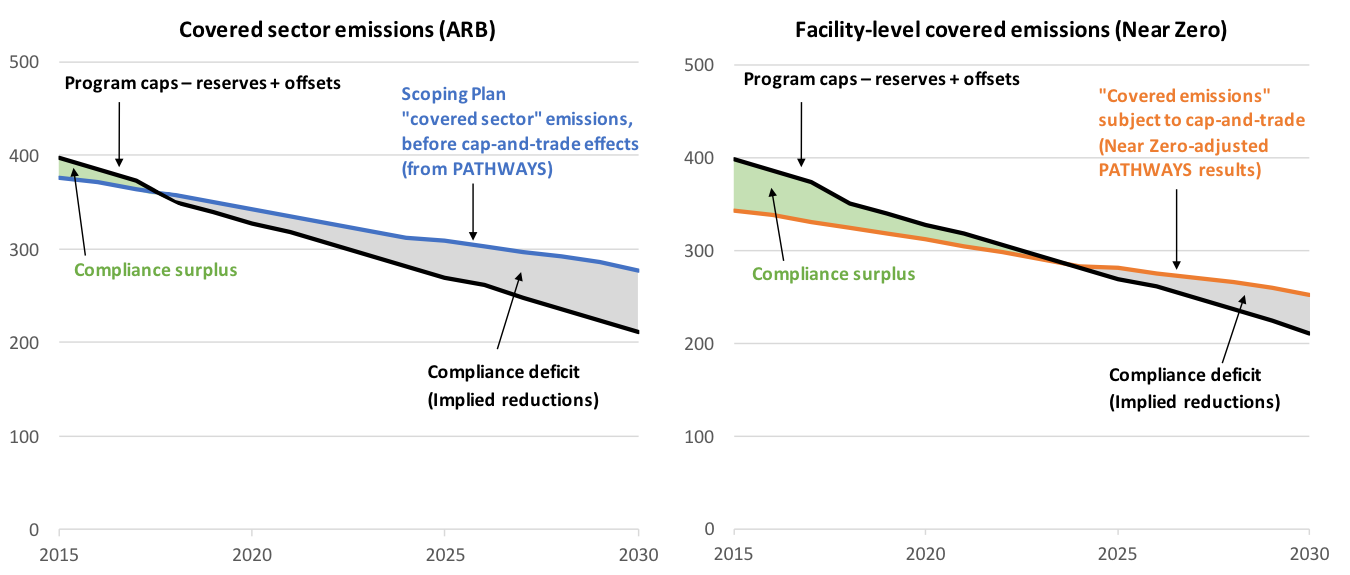
Figure 2: Comparison of annual cap-and-trade program supply-demand balance (million metric tons of CO2e). Both panels show the annual compliance instrument surplus (green) and deficits (grey), which are determined by the difference between projected emissions and the supply of compliance instruments from the cap-and-trade program. The panel on the left shows the effect of ARB’s inflated emission projections for “covered sector” emissions from the Scoping Plan scenario, and the panel on the right shows the expected outcome when ARB’s inflated emission projection is corrected.
Download the full comment letter (pdf) and accompanying data spreadsheet (Excel file).
submitted to the California Air Resources Board
Danny Cullenward *†, Mason Inman *, and Michael Mastrandrea *†
* Near Zero
† Carnegie Institution for Science, Department of Global Ecology